Home  /  Blog  /  Implementing Statistical Process Control
7 min read  •  Published September, 2026

5 key steps to successfully implementing Statistical Process Control (SPC)

What separates an SPC system that simply exists from one that truly supports decision-making.
In many manufacturing organisations, Statistical Process Control (SPC) is seen as a set of charts pinned up next to the production lines. In practice, it is much more than that: it is a system for monitoring and controlling the critical parameters of the process and of product quality, making it possible to detect variation before it turns into defects, waste or customer complaints. 

Implementing SPC effectively does not start with the charts — it starts well before that. In this article, we share the five key steps that, in our experience, make the difference between an SPC system that merely ‘exists’ and one that genuinely helps people make better decisions. 
In this article

01  Ensure reliable measurement systems and data traceability
Everything starts with measurement. Before analysing any data, you need to make sure that the systems measuring the critical parameters of the process and of product quality are working correctly and have adequate resolution to assess process variability. 

Think of a checkweigher that continuously measures the quantity packed into each pack and sends signals to the packaging machine to adjust the filling whenever the weight falls outside the defined limits. If this scale is not working correctly, the impact can be huge: the company may lose money by overfilling or, in the opposite scenario, underfill packs relative to the declared quantity, breaching the law and consumer rights. 

The resolution of the equipment is another critical aspect. It makes no sense to control 250 g packs with a scale that weighs in 5-gram increments, or even in 1-gram increments. Ideally, you should have at least one decimal place, measuring in increments of 0.1 g. 

Equally important is ensuring the traceability of measurements: we need to know which product, production order and batch each measured value refers to. Otherwise, there is no point in measuring at all. 

Golden rule: if the data is not reliable, it is not possible to implement SPC of any kind. 
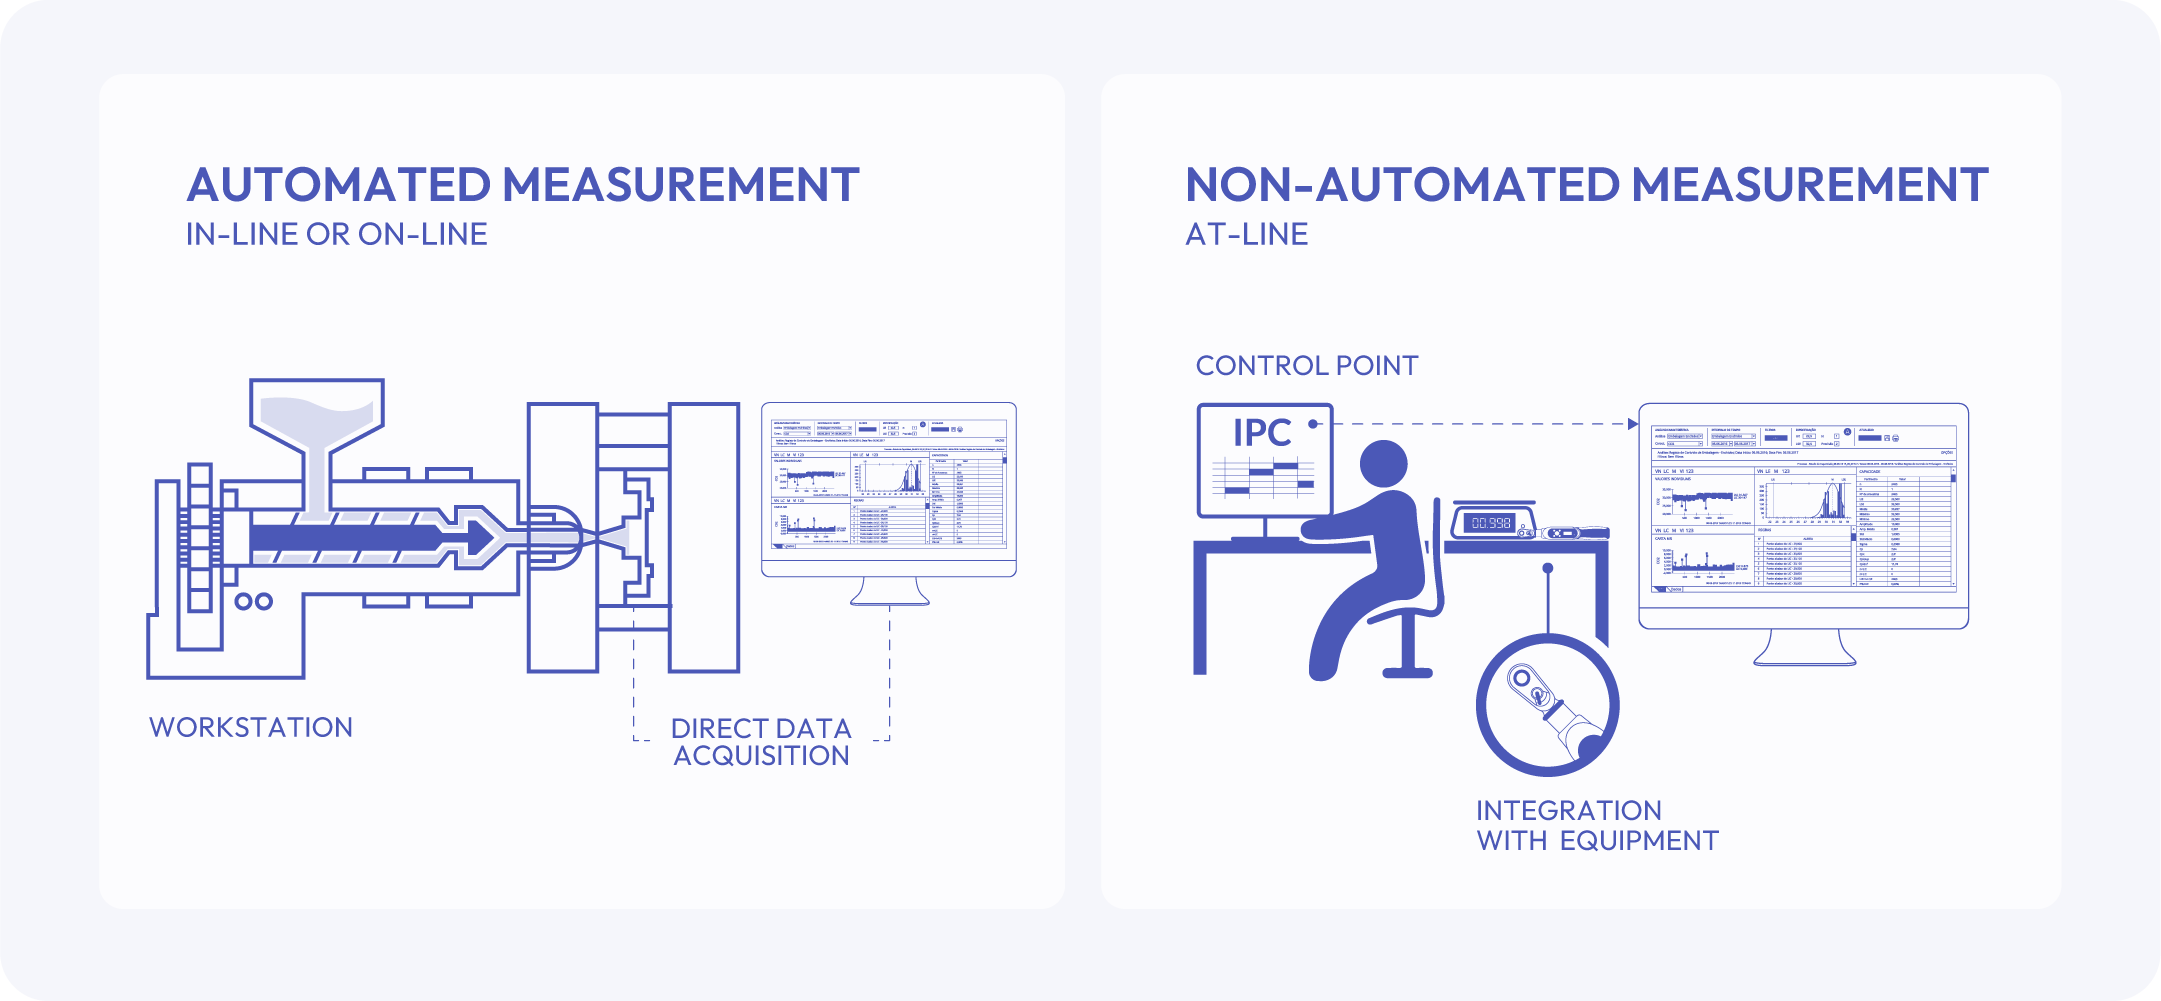
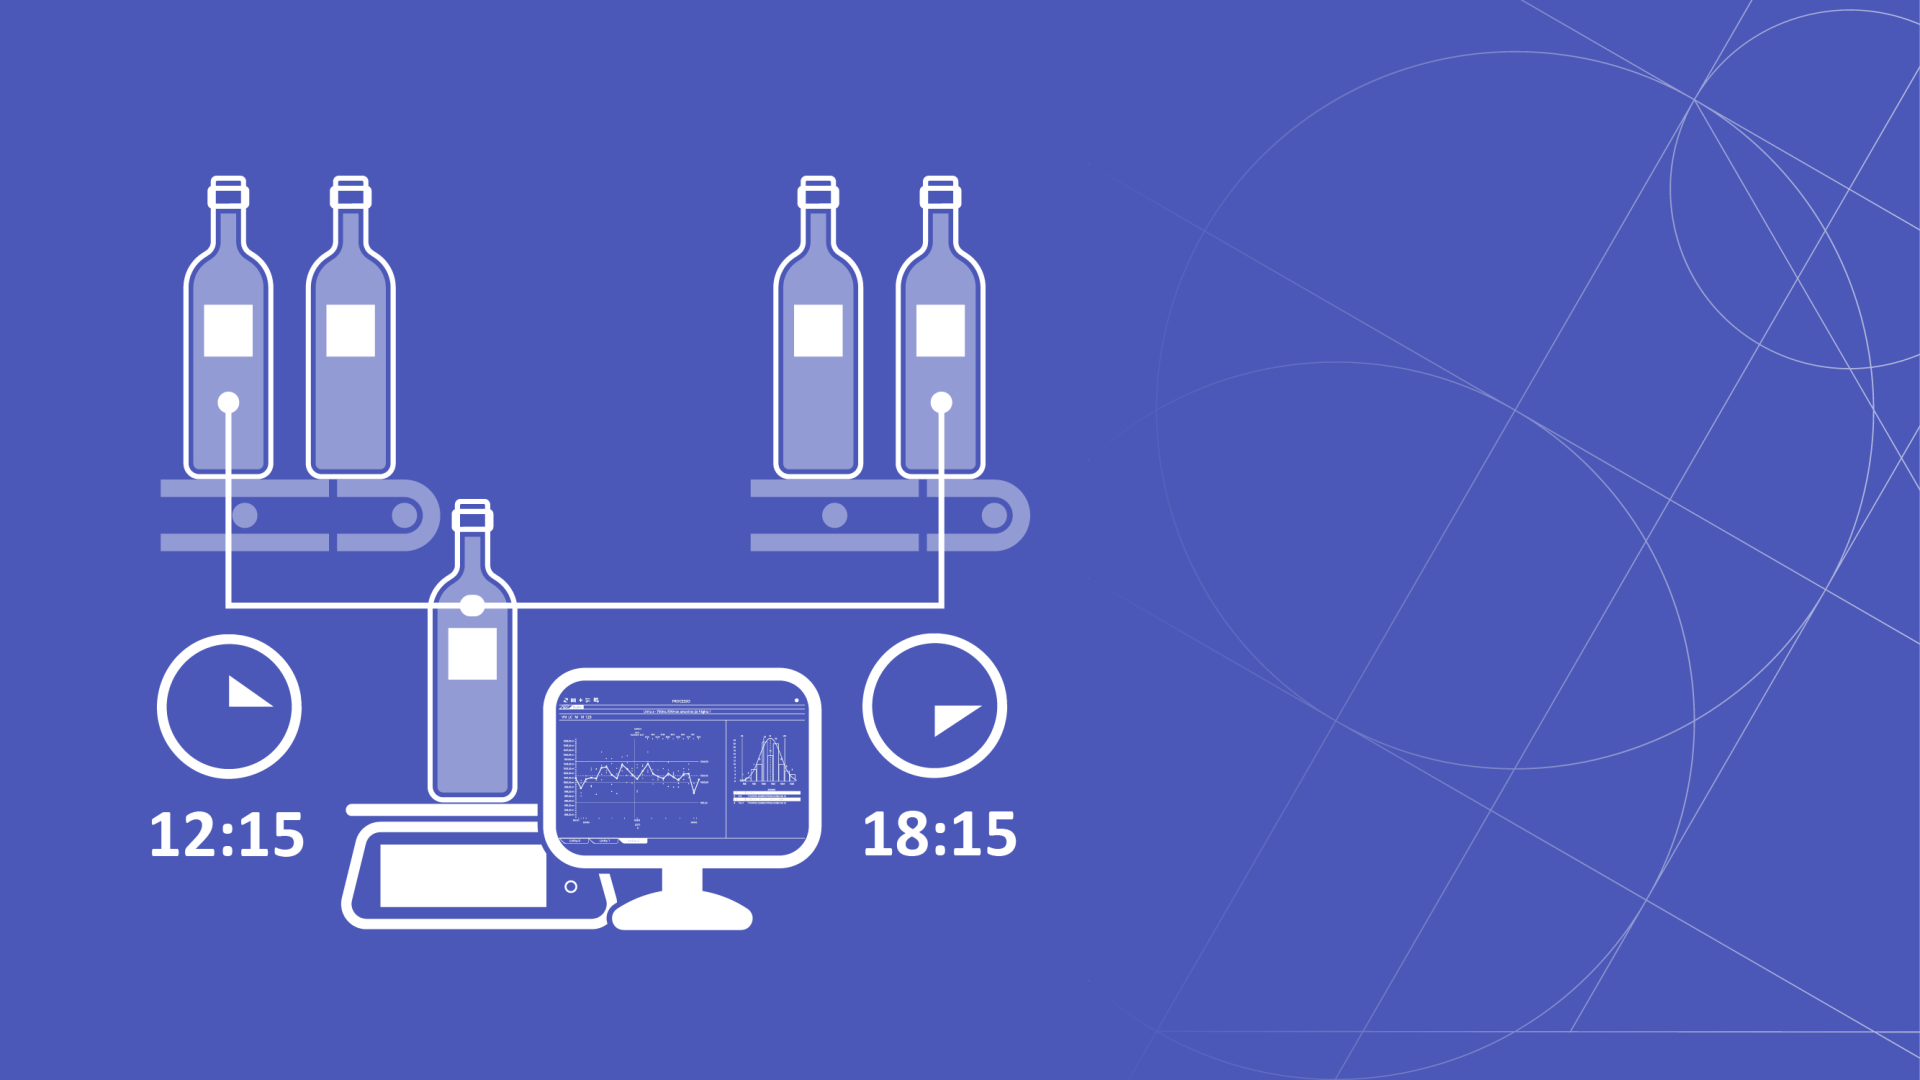
Automated (in-line or on-line) and non-automated (at-line) measurement. In both cases, data flows directly from the equipment to the SPC system, ensuring reliability and traceability.

02  Define the data collection strategy
Once measurement systems are capable and data identification is ensured, the next step is data collection. This can be done on 100% of the output or, where that is not possible, by sampling at a regular frequency that allows process variability to be monitored. 

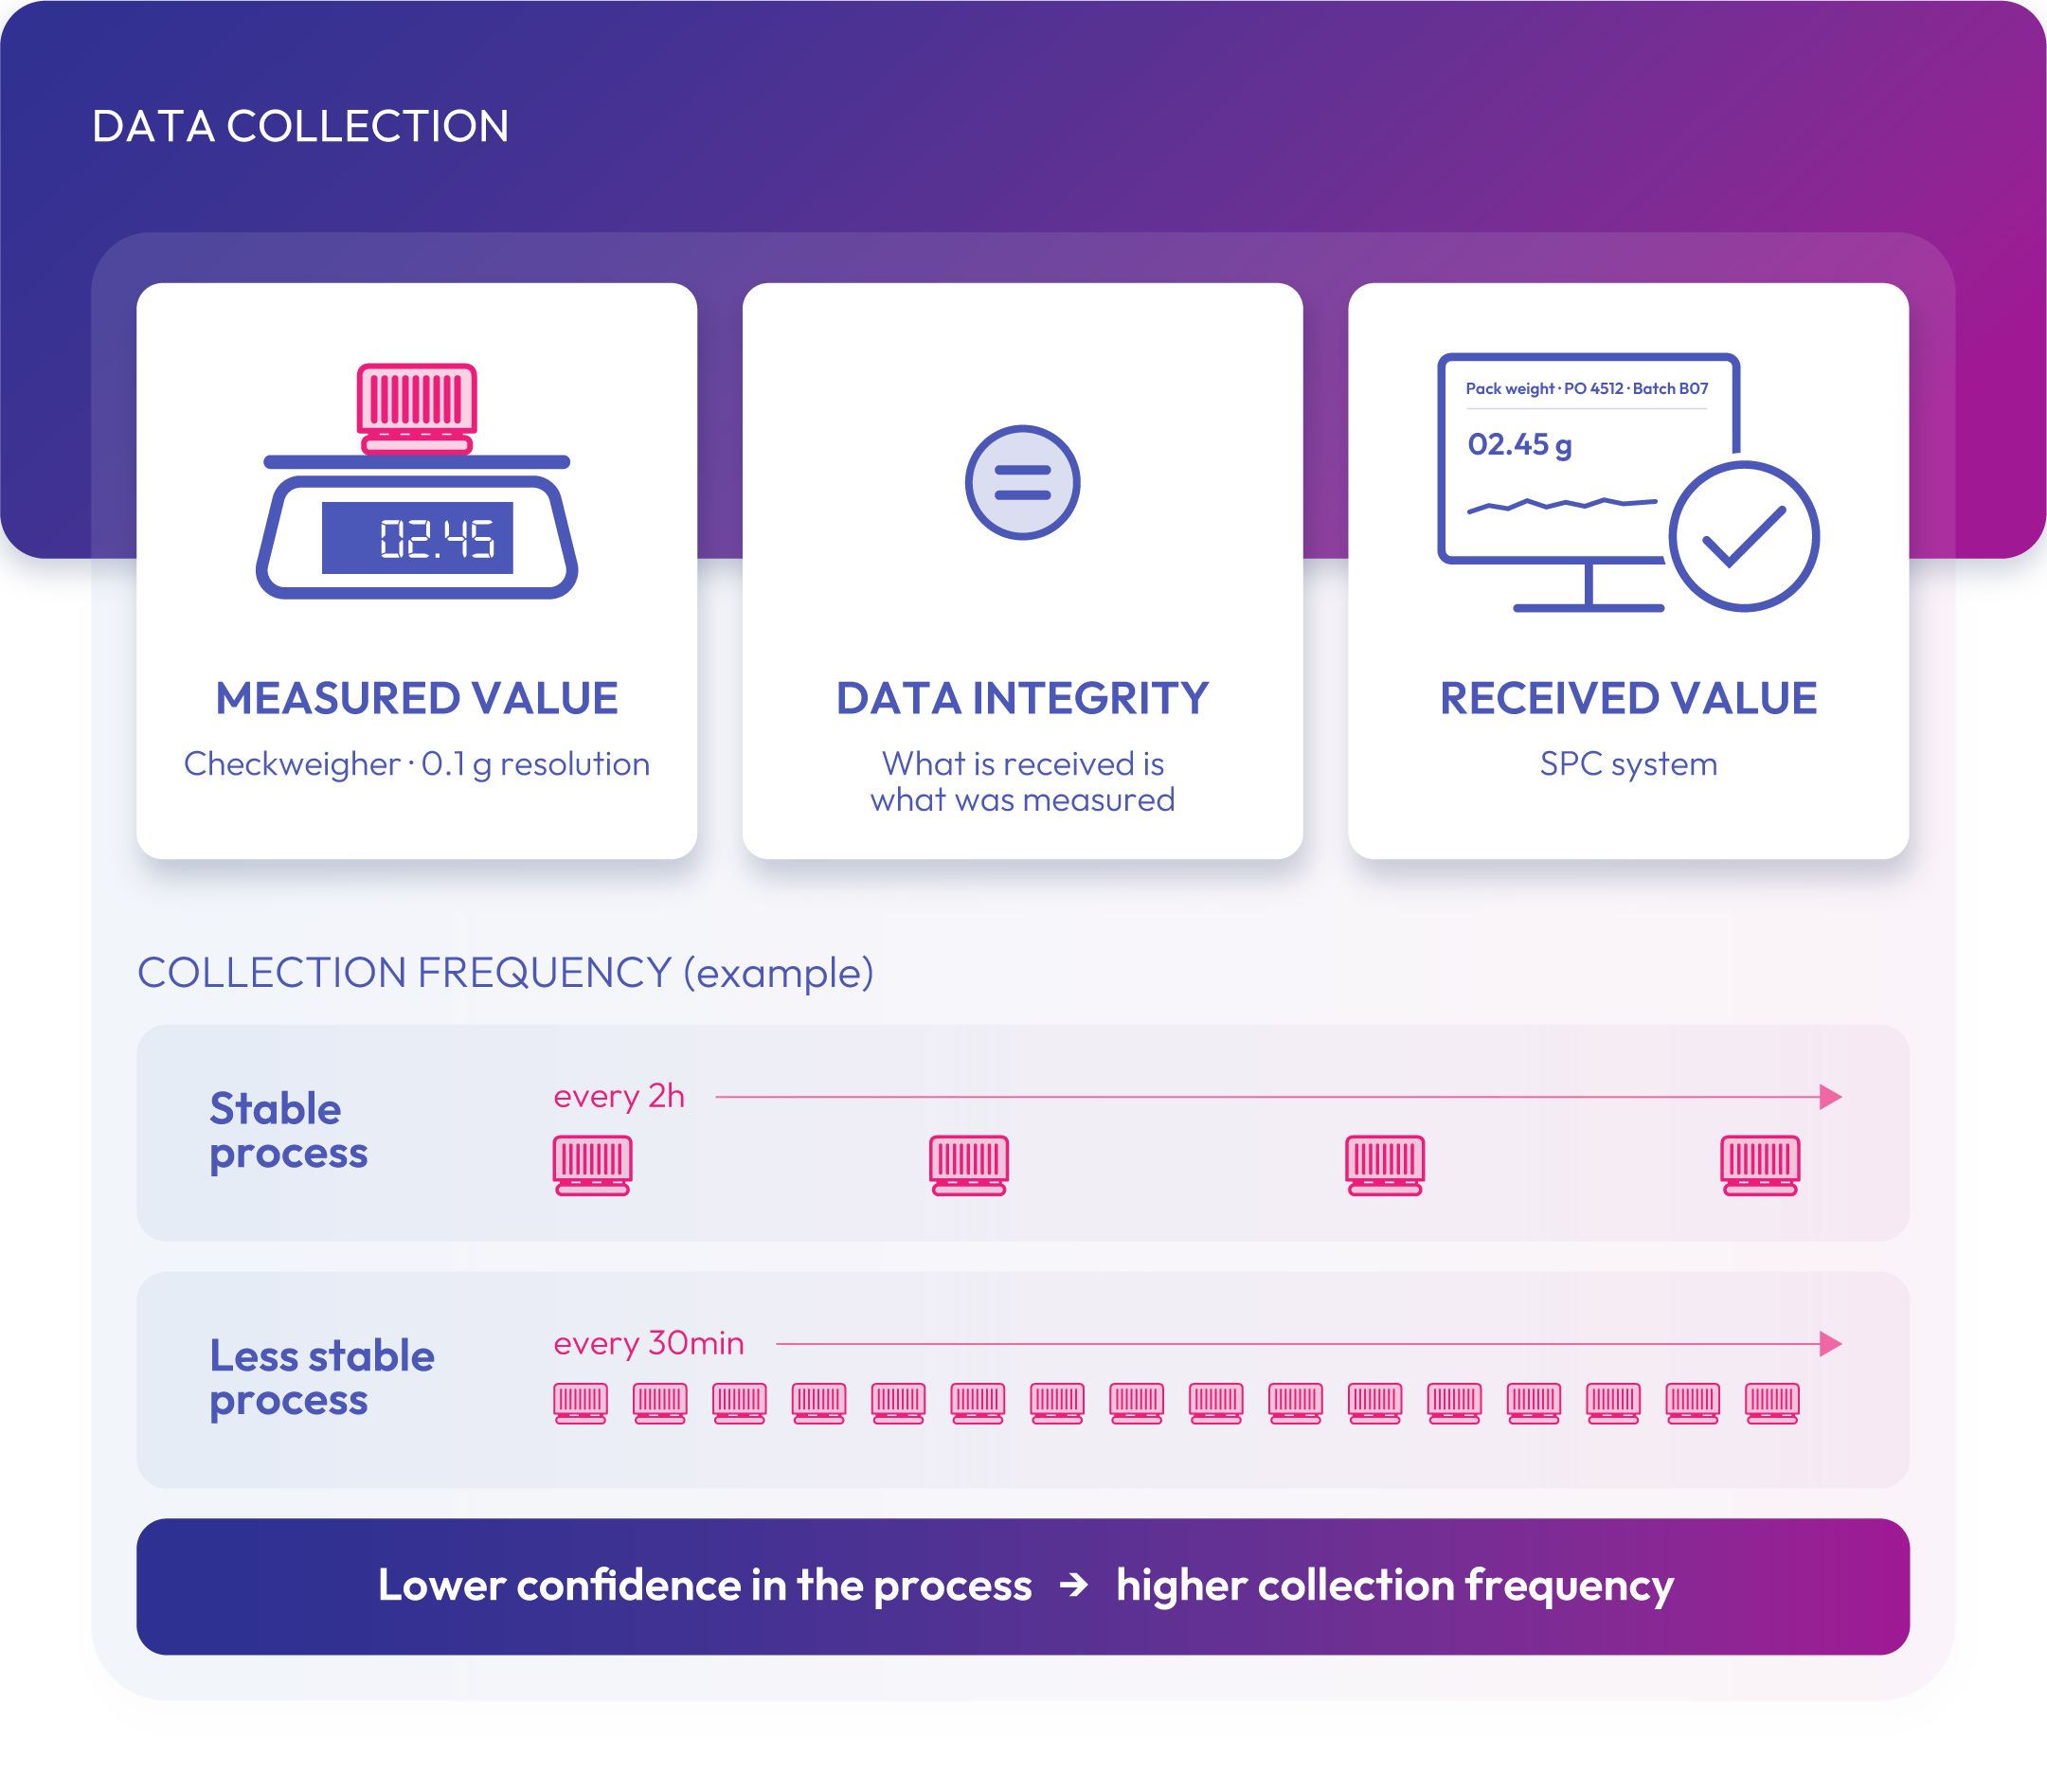
The collection frequency should reflect the level of confidence in the process. When processes are less stable or there is little confidence in what is being produced, samples need to be taken more frequently (for example, every 30 minutes), or 100% measurement systems with automatic rejection may even be required. 
Data collection. The value received by the system must match the value measured, and the collection frequency should reflect the level of confidence in the process.

03  Structure and index the information

Reliable data only becomes truly useful when it is properly organised. Each measurement should be linked to its context: 

  • the parameter measured and whether it relates to the machine or to the product;
  • the machine or line where the value was collected; 
  • the product, the production order and the batch; 
  • the person responsible for supervision at the time of measurement. 

It is this indexing that later makes it possible to compare machines, shifts or batches and quickly get to the root causes of a deviation.

Each measurement is indexed to its context (production order, product, shift and operator), ensuring full traceability.

04  Build simple, fit-for-purpose analysis dashboards 
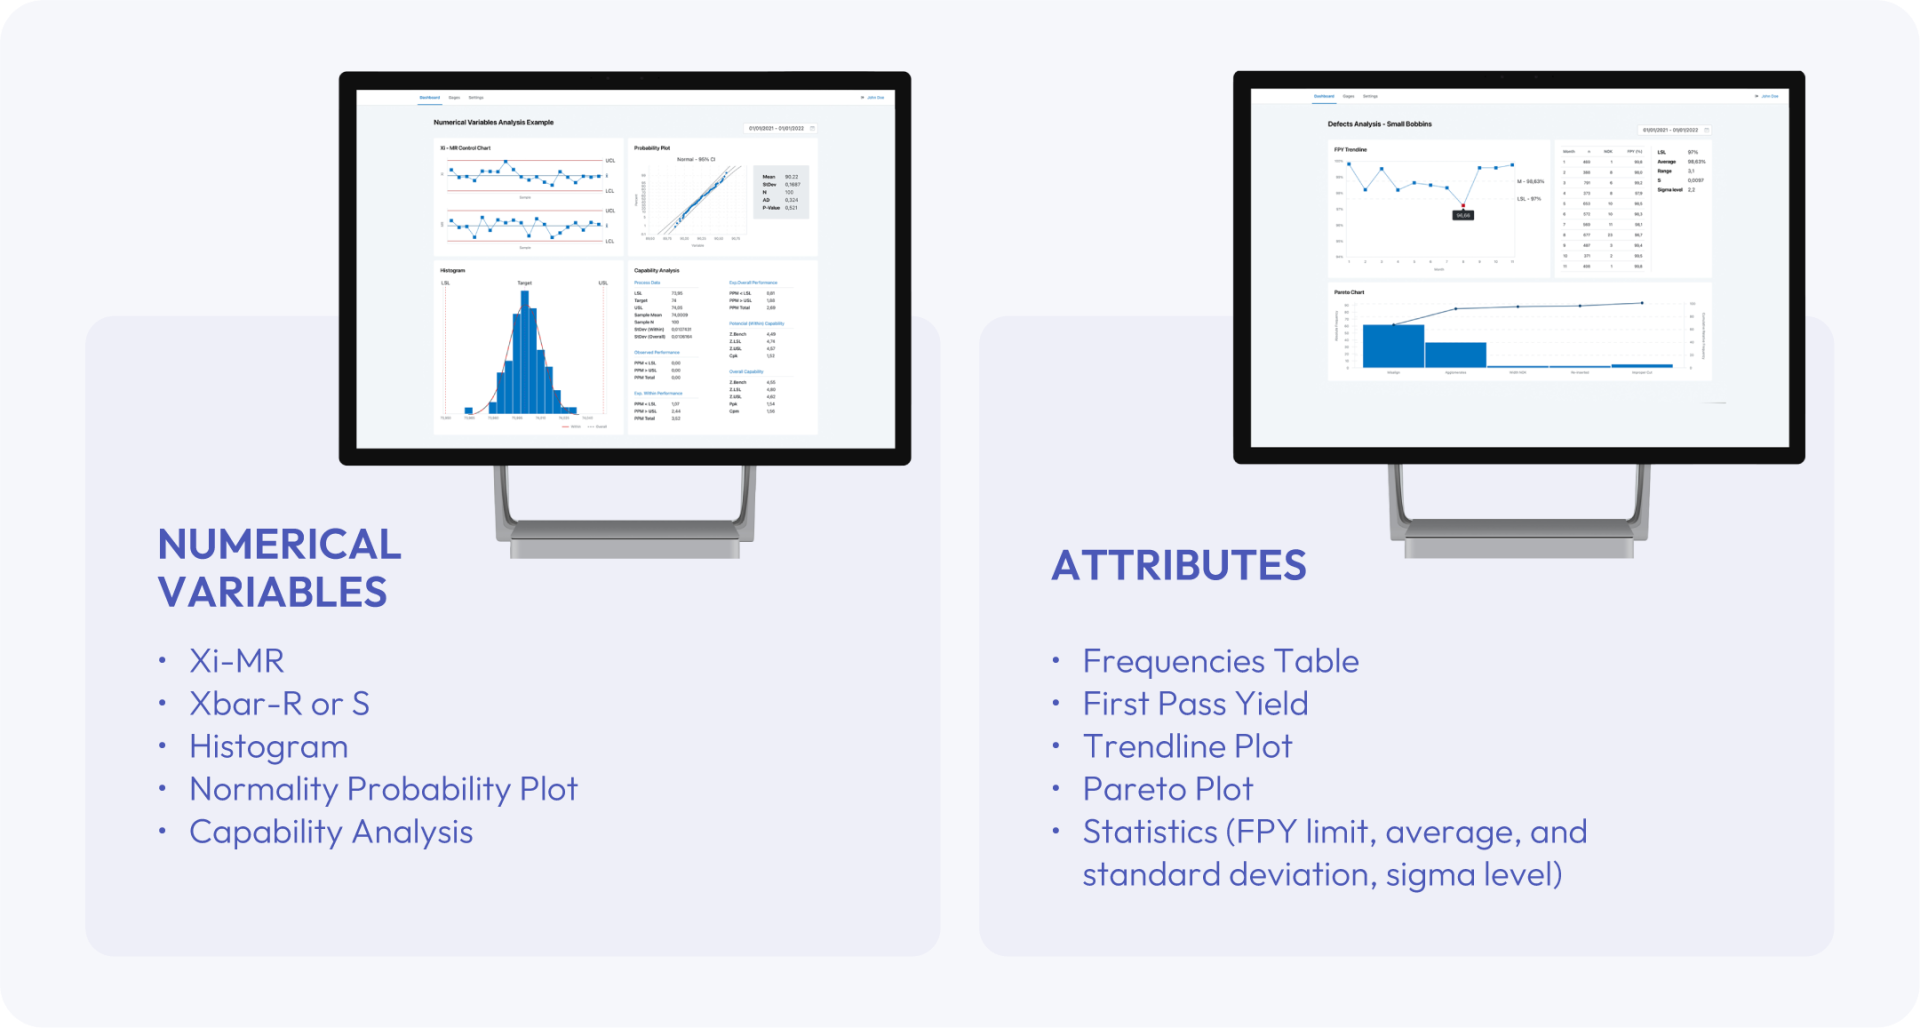
There is no point in investing in a measurement infrastructure if the data is then not analysed correctly and simply. The choice of tools depends on the type of data: 

  • Variables data: for numerical parameters that should follow a target value, such as the packed quantity, variables control charts, averages and ranges, or individual values and moving range, make it possible to assess a parameter’s performance over time. The histogram complements this analysis, helping to check whether the data follows a normal distribution.
  • Attributes data: when analysing defects, the Pareto chart is essential for understanding which defects are most significant and what may be causing them. 
  • First Pass Yield (FPY): calculating this indicator and tracking its trend over time is particularly valuable. FPY is given by FPY = exp(−D/U), where D is the number of defects and U is the number of units inspected.
Fit-for-purpose dashboards. For variables data: control charts, histogram, normality plot and capability analysis. For attributes data: frequencies table, First Pass Yield, trendline and Pareto chart.

05  Assess process capability

After analysing how the data behaves, if the numerical parameter under study (a weight, a dimension, etc.) follows a normal distribution and customer specifications exist, process capability can be calculated: 

  • Cp - potencial capability: indicates whether the process variability fits within the specified tolerance. 
  • Cpk - actual capability: also considers how well the process is centred relative to the specification limits. 

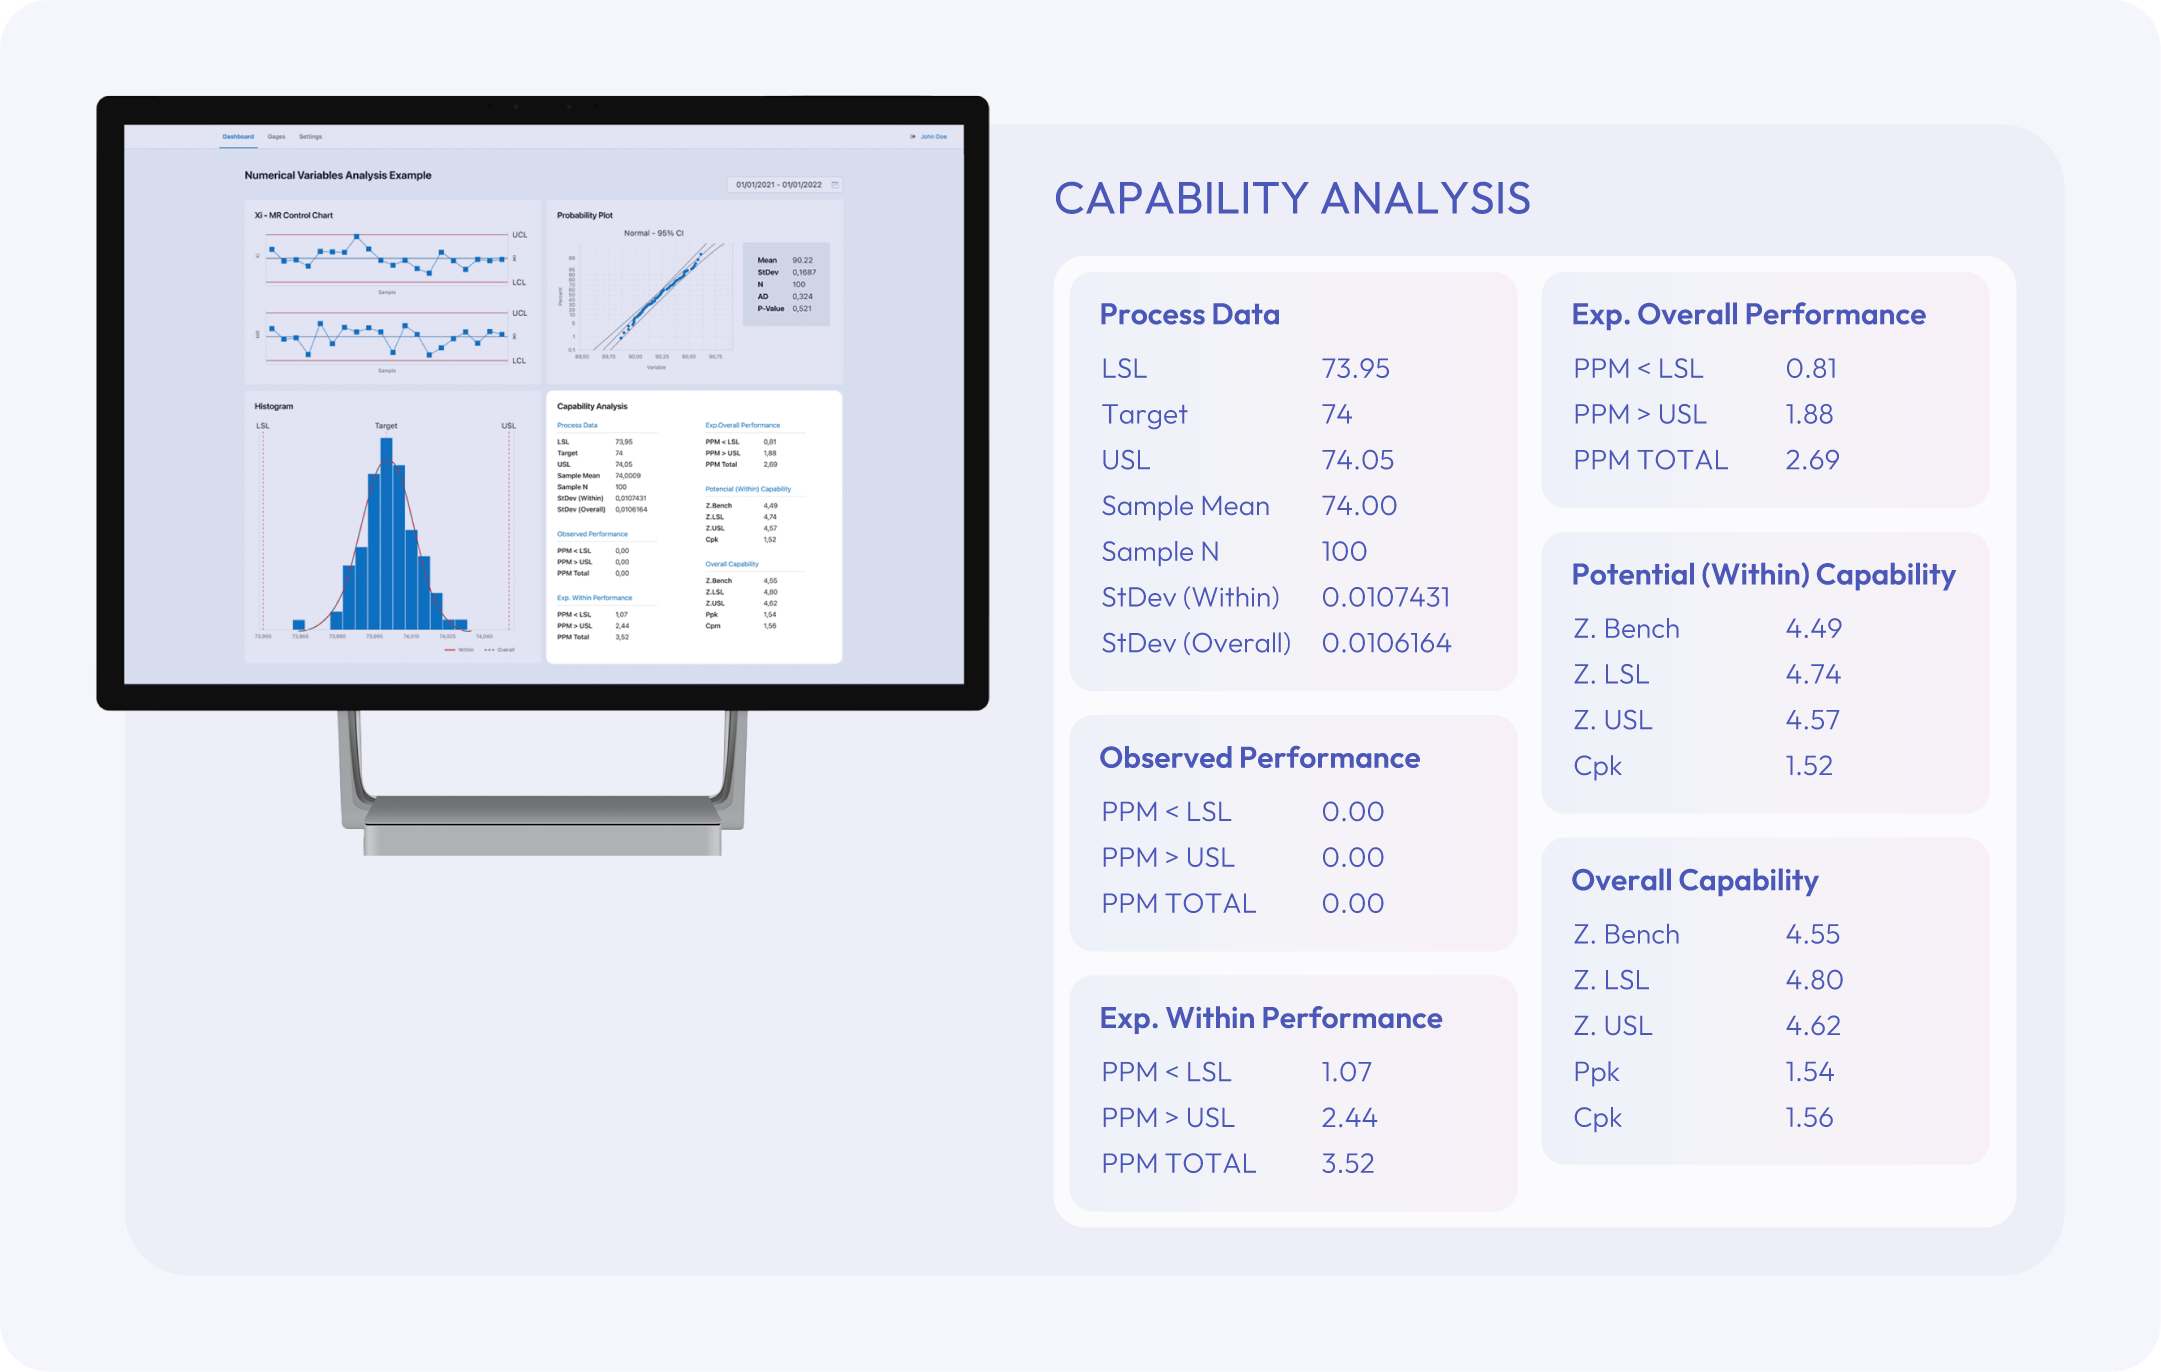
These indices answer an essential question: is the process, as it stands today, capable of consistently meeting what the customer requires?

Example of a capability analysis. With Cpk = 1.52, the process is capable and well centred relative to the specification limits.

Test your knowledge

Answer five questions and find out whether you are ready to implement SPC in your organisation. It takes about two minutes.

Learn how to apply these steps in our SPC Workshop 

Take your knowledge further at our Statistical Process Control (SPC) workshop on 29 October, from 14h to 18h (UTC+0). A hands-on session covering each of these five steps, the calculations behind them and real industrial examples, so you leave with tools you can apply straight away.

Available SPC courses

For those who wish to deepen their knowledge, our academy also offers dedicated training in Statistical Process Control: 

Data analysis foundation

First course in the EDA & SPC program, it introduces the data analysis roadmap, data quality, variable types, charts and basic statistics for data exploration.

Statistical Metrics & Normal Distribution
Second course in the EDA & SPC program, it deepens your skills with advanced metrics and distribution concepts to interpret data and support improvement.

Statistical Process Control & Capability Analysis

Third course in the EDA & SPC program, learn core SPC methods, including control charts and variation analysis, to monitor and improve process stability.